
For the EI retreat recently, for one of three short videos I generated for my presentation, I converted my code for the “Distributed Fishery Commons”, an simple ABM, to 2-D. Each dot in the video is a virtual boat, fishing down a path in its wake. The boats never directly interact, other than to not fish at the same location. They just move to where they see the most fish, and the result is an intricate dance or bouncing around. Take a look:
Entries categorized as ‘Research’
Science 2.0
June 9, 2014 · Leave a Comment
Science is constantly changing– we’re generating new data and developing new models faster than we can understand how they should all fit together.
My tool, the Distributed Meta-Analysis System, is ready to go, and I want to write more about it. But I also want to point people to two other interesting projects that seem to be trying to make science work better:
The Open Science Framework is trying to get people to make their data and papers and science, in general, available for all.
Curate Science is trying to solve the replication problem, encourage people to post their replication results and identifying needs.
For me, this is also about what might be called “Evolutionary Modeling”: modeling as a social and ongoing endeavor, involving many groups and combining their results in institutional ways. Science 2.0 is coming.
Categories: Research
Impulse Responses to ENSO
June 7, 2014 · Leave a Comment
El Nino and La Nina affects crops in a lot of different ways. I’ve been looking at the response of agricultural yields over time to an ENSO event, where, depending on the dynamics of the social-natural system, impacts could persist for years after the impact or even emerge before the impact.
Here’s what country-wide production look like, in this impulse response framework. Neither Chile nor Egypt show a response to La Nina, but they both have strong responses (which appear to oscillate) to Modoki El Ninos.

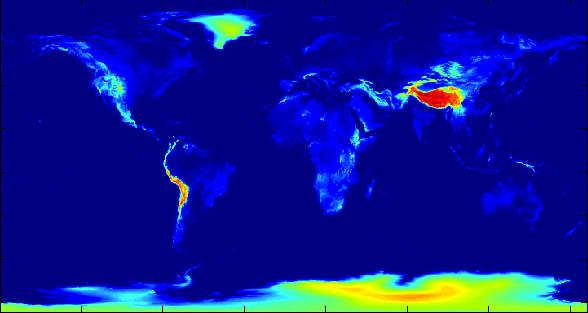
The map below shows areas where Maize is grown (anywhere but black). Areas in white show no significant response from ENSO. Colored areas deviate from grey in three bands: red for a response to traditional El Ninos, green for a response to Modoki El Ninos, and blue for La Ninas.

Categories: Research
Grain-Weighted Elevation Map
March 9, 2014 · Leave a Comment
Elevation can be an important variable to consider, but the elevations represented in a digital elevation model (DEM) might not correspond very well to those that impact people. Agriculture can be a good proxy for where people are.
First, I generated a .5x.5 degree map of where grains are grown (barley, maize, millet, rice, sorghum, soybeans, and wheat). Then I used it to generate a .5x.5 degree DEM, based on GLOBE, where the elevation of each grid cell is a average of the elevations available in the finer resolution of GLOBE, weighted by the area of grains grown in the coarse pixel.
Here’s an image of the DEM. Download the 360×720 CSV.
Tools for Analyzing the EM-DAT Disaster Database
February 15, 2014 · Leave a Comment
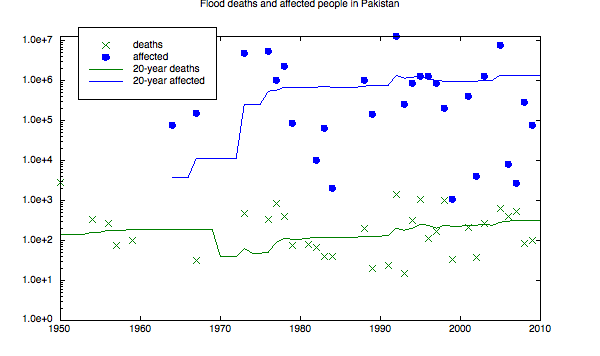
The CRED EM-DAT database is a collection of information about disasters, which you can search and download. However, the form that its provided in can be inconvenient for immediate cross-country analysis. Here you can download it as a spreadsheet (along with the requisite agreement).
Given the unreliability of this data, sometimes the best analysis is the simplest. But I made three tools for some additional work. These are MATLAB functions, and the first step is to export a subset of the data as a csv, with the date columns formatted as numbers.
Simple plotting of EM-DAT totals (with running average): download zip
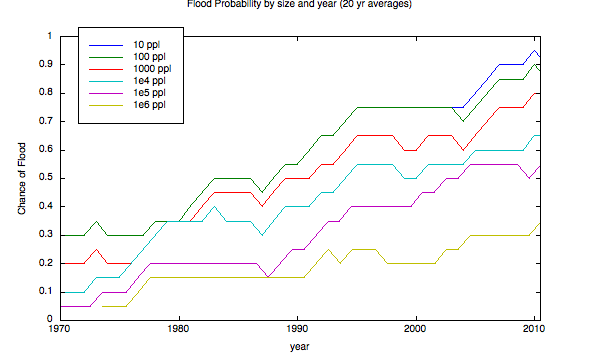
Plotting the probability of disasters of a given size: download zip
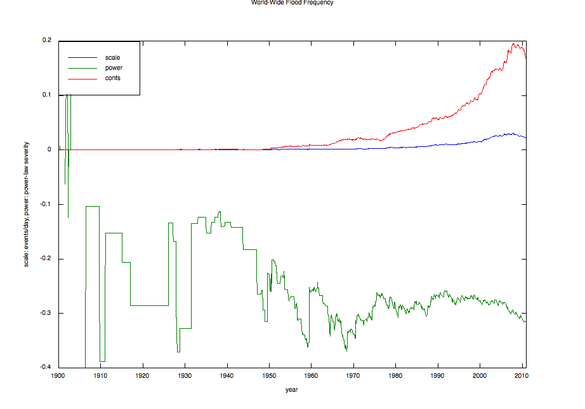
Attempt to find a power-law in disasters frequencies (changing in time): download zip
The Logistic Map in Action
January 24, 2014 · Leave a Comment
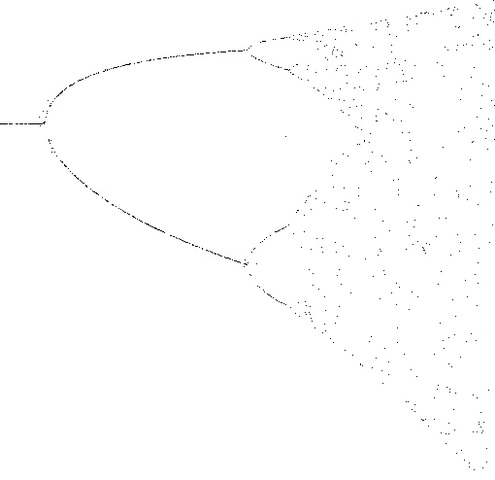
Everyone’s heard of the logistic map:

It’s elegant, it’s powerful (a classic for modeling ecosystems, e.g.), and it’s incredibly chaotic. As you change r, its internal frequency doubles, and then redoubles over a shorter span, and then again and again, until it reaches an infinity frequency over a finite distance. So you get beautiful fractal pictures like the following, bursting with internal structure:
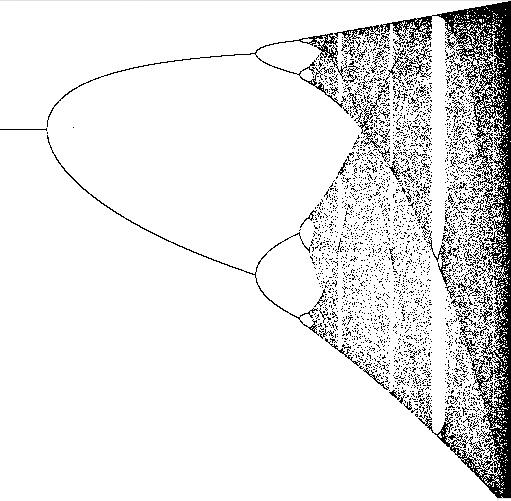
But they rarely tell you how you get the picture, or what it means. The closest you get is that these are “asymptotic” values– a meaningless statement for something that never settles down.
So, I made an animation. In it, I just keep adding new points, each with a value of r and an initial value of x, and let them fly.
Categories: Research
Meta-Analysis Tool at AGU
December 12, 2013 · Leave a Comment
My second poster at AGU is on work with Solomon Hsiang and Bob Kopp, describing a new tool for comparing empirical results and performing meta-analyses. We are currently aiming the tool at climate impacts, but hope to expand its use to other fields.
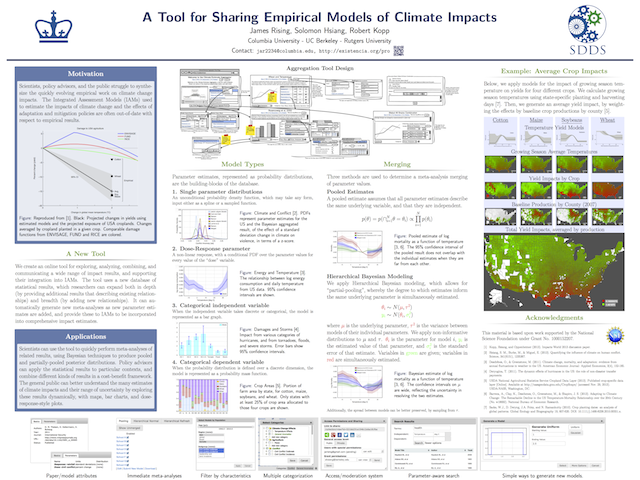
If you would like to try out the tool, go to the Alpha Testing Site.
Agriculture and Conflict at AGU
December 9, 2013 · Leave a Comment
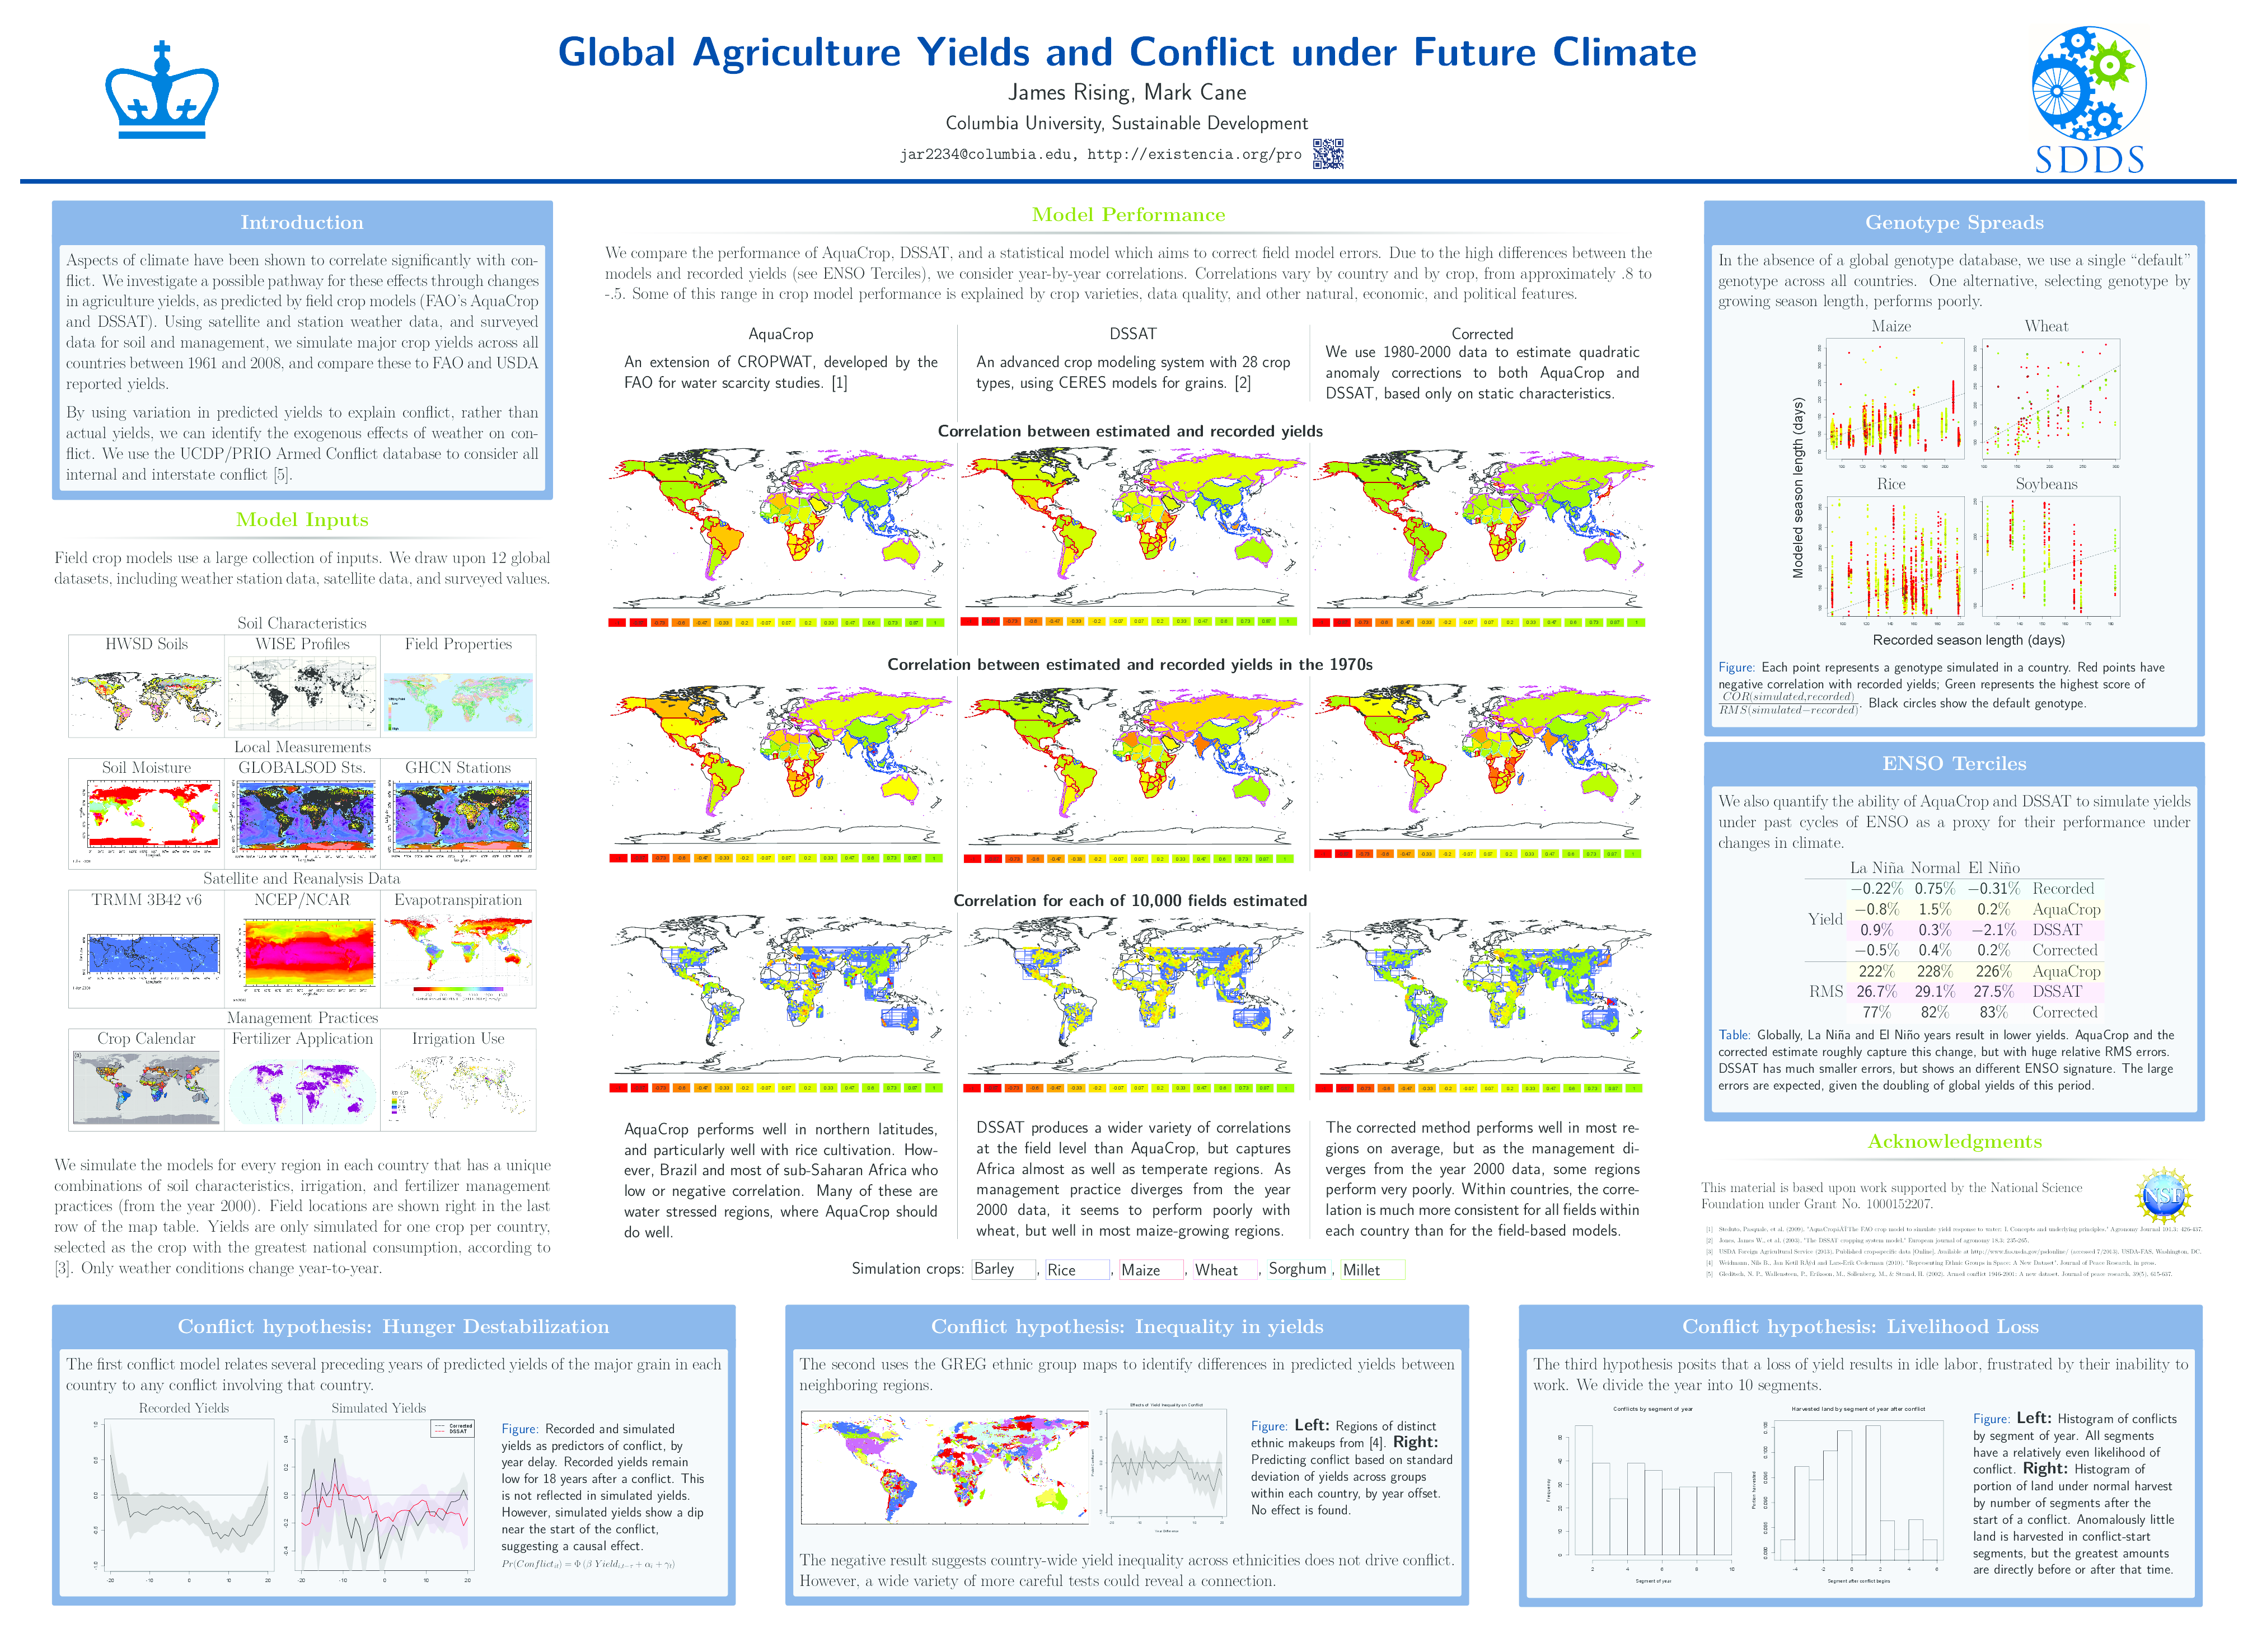
I have a poster at AGU presenting my work with Mark Cane on using process-based crop models to predict agricultural yields, and then using those predicted yields as exogenous variation to predict conflict.
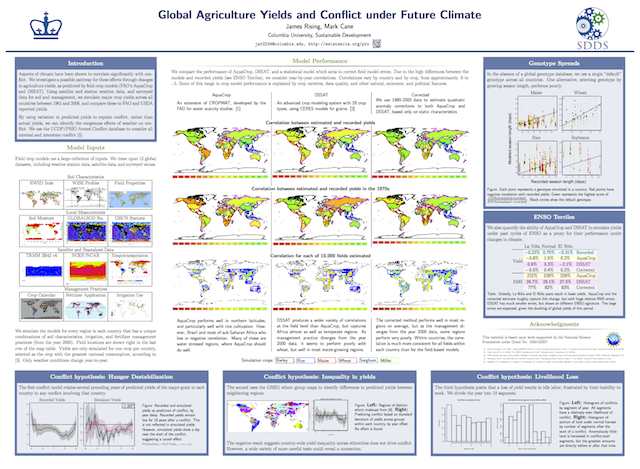
(The poster is big: try looking at the lower resolution PNG version if you have trouble.)
Additional material is available in several forms, but the most fully consolidated form (focused just on the yield results) is this document which I brought to the AgMIP conference in NYC last month: AgMIP Summary.
Categories: Research
Open Model Proposal
October 3, 2012 · Leave a Comment
I am presenting the Open Model at EcoSummit 2012 this week. Here’s my poster. I want to frame it as a proposal– a vision for a better framework for combining models and analyzing social-ecological systems– but huge parts of it are built and ready for use. Now I’m just looking for more people to start using it!
Here’s another version of the idea, as a vision statement for a coupled natural-human systems project: Read about the Fisheries Project. You can see a more concrete outline of the existing material.
Categories: Research
Non-Renewable Spaceship
January 4, 2012 · Leave a Comment
The goal of the Non-Renewable Spaceship project is to sketch the needs for a functioning ecosystem capable of sustaining a given population in space. Two motivations underlie this research: First, to construct a scenario which motivates society to set aside non-renewable resources for an indefinite future (in case of catastrophe, or if we find that “weak sustainability†is insufficient after all). Second, to try to answer E. O. Wilson’s question, “What do we need to save, for a healthy future world?†I’ve already worked out some of the principle resources: space, water, take-off fuel needs, and the ecosystem diversity that can be maintained under it.
See my presentation to the SDev student colloquium (results near the end). Try out different parameters of a partial model.
Categories: Research