James A. Rising

Entries categorized as ‘Software’

Probabilistic Coupling

May 1, 2017 · Leave a Comment

Environmental Modelling & Software has just published my work on a new technique for coupling models: Probabilistic Coupling. My thoughts on coupled models had been percolating for a couple years, before a session at the International Conference on Conservation Biology in 2013 offered me a chance to try it out.

Probabilistic coupling has three main goals:

  • Allowing models to be coupled without distortionary feedback
  • Allowing multiple models to inform the same variable
  • Allowing models to be coupled with different scales

With these three features, the very nature and approach of coupling models can change. Current model coupling requires carefully connecting models together, plugging inputs into outputs, and then recalibrating to recover realistic behavior again. Instead, this allows for what I call “Agglomerated Modeling”, where models are thrown together into a bucket and almost magically sort themselves out.

The code for the model is available within the OpenWorld framework, as the coupling example.

Categories: Research · Software

Tropict: A clearer depiction of the tropics

January 15, 2016 · Leave a Comment

Tropict is a set of python and R scripts that adjust the globe to make land masses in the tropics fill up more visual real estate. It does this by exploiting the ways continents naturally “fit into” each other, splicing out wide areas of empty ocean and nestling the continents closer together.

All Tropict scripts are designed to show the region between 30°S and 30°N. In an equirectangular projection, that looks like this:

original

It is almost impossible to see what is happening on land: the oceans dominate. By removing open ocean and applying the Gall-Peters projection, we get a clearer picture:

version4

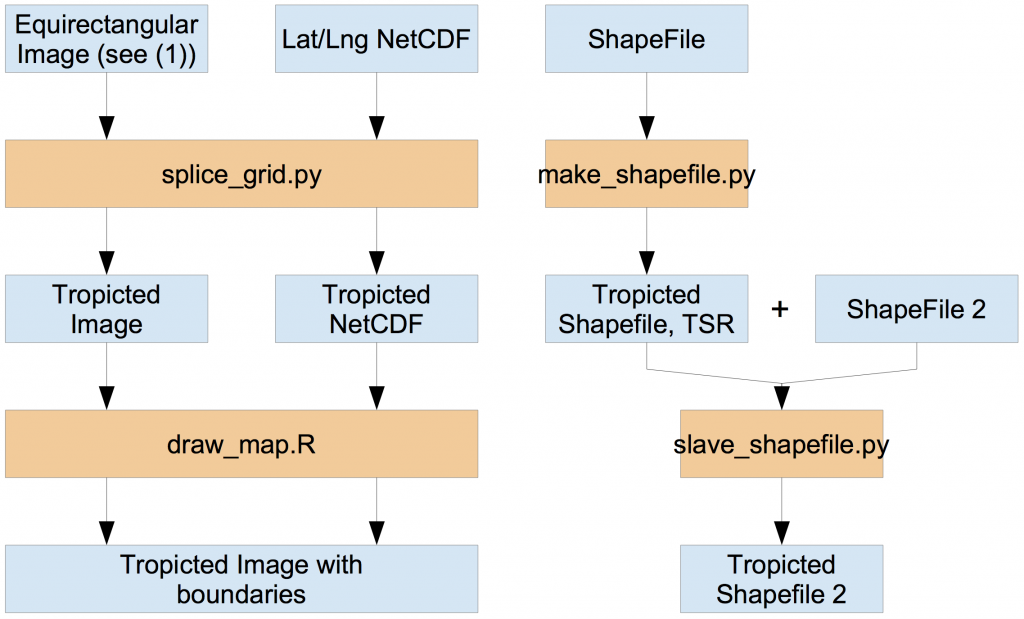
There’s even a nice spot for a legend in the lower-left! Whether for convenience or lack of time, the tools I’ve made to allow you to make these maps are divided between R and Python. Here’s a handy guide for which tool to use:

decisions

(1) Supported image formats are listed in the Pillow documentation.
(2) A TSR file is a Tropict Shapefile Reinterpretation file, and includes the longitudinal shifts for each hemisphere.

Let’s say you find yourself with a NetCDF file in need of Tropiction, called bio-2.nc4. It’s already clipped to between 30°S and 30°N. The first step is to call splice_grid.py to create a Tropicted NetCDF:

python ../splice_grid.py subjects/bio-2.nc4 ../bio-2b.nc4

But that NetCDF doesn’t show country boundaries. To show country boundaries, you can follow the example for using draw_map.R:

library(ncdf4)
library(RColorBrewer)

## Open the Tropicted NetCDF
database <- nc_open("bio-2b.nc4")
## Extract one variable
map <- ncvar_get(database, "change")

## Identify the range of values there
maxmap <- max(abs(map), na.rm=T)

## Set up colors centered on 0
colors <- rev(brewer.pal(11,"RdYlBu"))
breaks <- seq(-maxmap, maxmap, length.out=12)

## Draw the NetCDF image as a background
splicerImage(map, colors, breaks=breaks)
## Add country boundaries
addMap(border="#00000060")
## Add seams where Tropict knits the map together
addSeams(col="#00000040")

Here’s an example of the final result, for a bit of my coffee work:

arabica-futureb

For more details, check out the documentation at the GitHub page!

And just for fun, here were two previous attempts of re-hashing the globe:

version1

I admit that moving Australia and Hawaii into the India Ocean was over-zealous, but they fill up the space so well!

version3

Here I can still use the slick division between Indonesian and Papua New Guinea and Hawaii fits right on the edge, but Australia gets split in two.

Enjoy the tropics!

Categories: Software

Google Scholar Alerts to RSS: A punctuated equilibrium

May 14, 2015 · Leave a Comment

If you’re like me, you have a pile of Google Scholar Alerts that you never manage to read. It’s a reflection of a more general problem: how do you find good articles, when there are so many articles to sift through?

I’ve recently started using Sux0r, a Bayesian filtering RSS feed reader. However, Google Scholar sends alerts to one’s email, and we’ll want to extract each paper as a separate RSS item.

alertemail

Here’s my process, and the steps for doing it yourself:

Google Scholar Alerts → IFTTT → Blogger → Perl → DreamHost → RSS → Bayesian Reader

  1. Create a Blogger blog that you will just use for Google Scholar Alerts: Go to the Blogger Home Page and follow the steps under “New Blog”.
  2. Sign up for IFTTT (if you don’t already have an account), and create a new recipe to post emails from scholaralerts-noreply@google.com to your new blog. The channel for the trigger is your email system (Gmail for me); the trigger is “New email in inbox from…”; the channel for the action is Blogger; and the title and labels can be whatever you want as along as the body is “{{BodyPlain}}” (which includes HTML).

    ifttttrigger

  3. Modify the Perl code below, pointing it to the front page of your new Blogger blog. It will return an RSS feed when called at the command line (perl scholar.pl).

    rssfeed

  4. Upload the Perl script to your favorite server (mine, https://existencia.org/, is powered by DreamHost.
  5. Point your favorite RSS reader to the URL of the Perl script as an RSS feed, and wait as the Google Alerts come streaming in!

Here is the code for the Alert-Blogger-to-RSS Perl script. All you need to do is fill in the $url line below.

#!/usr/bin/perl -w
use strict;
use CGI qw(:standard);

use XML::RSS; # Library for RSS generation
use LWP::Simple; # Library for web access

# Download the first page from the blog
my $url = "http://mygooglealerts.blogspot.com/"; ### <-- FILL IN HERE!
my $input = get($url);
my @lines = split /\n/, $input;

# Set up the RSS feed we will fill
my $rss = new XML::RSS(version => '2.0');
$rss->channel(title => "Google Scholar Alerts");

# Iterate through the lines of HTML
my $ii = 0;
while ($ii < $#lines) {
    my $line = $lines[$ii];
    # Look for a <h3> starting the entry
    if ($line !~ /^<h3 style="font-weight:normal/) {
        $ii = ++$ii;
        next;
    }

    # Extract the title and link
    $line =~ /<a href="([^"]+)"><font .*?>(.+)<\/font>/;
    my $title = $2;
    my $link = $1;

    # Extract the authors and publication information
    my $line2 = $lines[$ii+1];
    $line2 =~ /<div><font .+?>([^<]+?) - (.*?, )?(\d{4})/;
    my $authors = $1;
    my $journal = (defined $2) ? $2 : '';
    my $year = $3;

    # Extract the snippets
    my $line3 = $lines[$ii+2];
    $line3 =~ /<div><font .+?>(.+?)<br \/>/;
    my $content = $1;
    for ($ii = $ii + 3; $ii < @lines; $ii++) {
        my $linen = $lines[$ii];
        # Are we done, or is there another line of snippets?
        if ($linen =~ /^(.+?)<\/font><\/div>/) {
            $content = $content . '<br />' . $1;
            last;
        } else {
            $linen =~ /^(.+?)<br \/>/;
            $content = $content . '<br />' . $1;
        }
    }
    $ii = ++$ii;

    # Use the title and publication for the RSS entry title
    my $longtitle = "$title ($authors, $journal $year)";

    # Add it to the RSS feed
    $rss->add_item(title => $longtitle,
                   link => $link,
                   description => $content);
        
    $ii = ++$ii;
}

# Write out the RSS feed
print header('application/xml+rss');
print $rss->as_string;

In Sux0r, here are a couple of items form the final result:

sux0rfeed

Categories: Research · Software

Scripts for Twitter Data

April 22, 2015 · Leave a Comment

Twitter data– the endless stream of tweets, the user network, and the rise and fall of hashtags– offers a flood of insight into the minute-by-minute state of the society. Or at least one self-selecting part of it. A lot of people want to use it for research, and it turns out to be pretty easy to do so.

You can either purchase twitter data, or collect it in real-time. If you purchase twitter data, it’s all organized for you and available historically, but it basically isn’t anything that you can’t get yourself by monitoring twitter in real-time. I’ve used GNIP, where the going rate was about $500 per million tweets in 2013.

There are two main ways to collect data directly from twitter: “queries” and the “stream”. Queries let you get up to 1000 tweets at any point in time– whichever the most recent tweets that match your search criteria. The stream gives you a fraction of a percent of tweets continuously, which very quickly adds up, based on filtering criteria.

Scripts for doing these two options are below, but you need to decide on the search/streaming criteria. Typically, these are search terms and geographical constraints. See Twitter’s API documentation to decide on your search options.

Twitter uses an athentication system to identify both the individual collecting the data, and what tool is helping them do it. It is easy to register a new tool, whereby you pretend that you’re a startup with a great new app. Here are the steps:

  1. Install python’s twitter package, using “easy_install twitter” or “pip install twitter”.
  2. Create an app at https://apps.twitter.com/. Leave the callback URL blank, but fill in the rest.
  3. Set the CONSUMER_KEY and CONSUMER_SECRET in the code below to the values you get on the keys and access tokens tab of your app.
  4. Fill in the name of the application.
  5. Fill in any search terms or structured searches you like.
  6. If you’re using the downloaded scripts, which output data to a CSV file, change where the file is written, to some directory (where it says “twitter/us_”).
  7. Run the script from your computer’s terminal (i.e., python search.py)
  8. The script will pop up a browser for you to log into twitter and accept permissions from your app.
  9. Get data.

Here is what a simple script looks like:

import os, twitter

APP_NAME = "Your app name"
CONSUMER_KEY = 'Your consumer key'
CONSUMER_SECRET = 'Your consumer token'

# Do we already have a token saved?
MY_TWITTER_CREDS = os.path.expanduser('~/.class_credentials')
if not os.path.exists(MY_TWITTER_CREDS):
    # This will ask you to accept the permissions and save the token
    twitter.oauth_dance(APP_NAME, CONSUMER_KEY, CONSUMER_SECRET,
                        MY_TWITTER_CREDS)

# Read the token
oauth_token, oauth_secret = twitter.read_token_file(MY_TWITTER_CREDS)

# Open up an API object, with the OAuth token
api = twitter.Twitter(api_version="1.1", auth=twitter.OAuth(oauth_token, oauth_secret, CONSUMER_KEY, CONSUMER_SECRET))

# Perform our query
tweets = api.search.tweets(q="risky business")

# Print the results
for tweet in tweets['statuses']:
    if not 'text' in tweet:
        continue

    print tweet
    break

For automating twitter collection, I’ve put together scripts for queries (search.py), streaming (filter.py), and bash scripts that run them repeatedly (repsearch.sh and repfilter.sh). Download the scripts.

To use the repetition scripts, make the repetition scripts executable by running “chmod a+x repsearch.sh repfilter.sh“. Then run them, by typing ./repfilter.sh or ./repsearch.sh. Note that these will create many many files over time, which you’ll have to merge together.

Categories: Research · Software

Growing Degree-Day Calculations

December 11, 2014 · 2 Comments

Schlenker and Roberts (2009) use daily minimum and maximum temperatures to calculate growing degrees, rather than daily mean temperatures. This is important when the effect of extreme temperatures is an issue, since these often will not show up in mean temperatures.

Growing degree days form a useful model of crop productivity. DMAS has examples of these for maize, soybeans, and cotton.

To do this, they use a sinusoidal approximation, integrating the area of a curve through the minimum and maximum temperatures:
thresholds
(adapted from here— but don’t use their calculations!)

The calculations aren’t very difficult, but require some careful math. I had a need to write them in python and translate them to R, so I’m providing them here for anyone’s benefit.

import numpy as np
import warnings

warnings.simplefilter("ignore", RuntimeWarning)

def above_threshold(mins, maxs, threshold):
    """Use a sinusoidal approximation to estimate the number of Growing
Degree-Days above a given threshold, using daily minimum and maximum
temperatures.

mins and maxs are numpy arrays; threshold is in the same units."""

    # Determine crossing points, as a fraction of the day
    plus_over_2 = (mins + maxs)/2
    minus_over_2 = (maxs - mins)/2
    two_pi = 2*np.pi
    # d0s is the times of crossing above; d1s is when cross below
    d0s = np.arcsin((threshold - plus_over_2) / minus_over_2) / two_pi
    d1s = .5 - d0s

    # If always above or below threshold, set crossings accordingly
    aboves = mins >= threshold
    belows = maxs <= threshold

    d0s[aboves] = 0
    d1s[aboves] = 1
    d0s[belows] = 0
    d1s[belows] = 0

    # Calculate integral
    F1s = -minus_over_2 * np.cos(2*np.pi*d1s) / two_pi + plus_over_2 * d1s
    F0s = -minus_over_2 * np.cos(2*np.pi*d0s) / two_pi + plus_over_2 * d0s
    return np.sum(F1s - F0s - threshold * (d1s - d0s))

def get_gddkdd(mins, maxs, gdd_start, kdd_start):
    """Get the Growing Degree-Days, as degree-days between gdd_start and
kdd_start, and Killing Degree-Days, as the degree-days above
kdd_start.

mins and maxs are numpy arrays; threshold is in the same units."""

    dd_lowup = above_threshold(mins, maxs, gdd_start)
    dd_above = above_threshold(mins, maxs, kdd_start)
    dd_lower = dd_lowup - dd_above

    return (dd_lower, dd_above)

Download the code for R or python.

Categories: Research · Software

Python SoundTouch Wrapper

August 3, 2014 · Leave a Comment

SoundTouch is a very useful set of audio manipulation tools, with three powerful features:

  • Adjusting the pitch of a segment, without changing its tempo
  • Adjusting the tempo of a segment, without changing its pitch
  • Detecting the tempo of a segment, using beat detection

I used SoundTouch when I was developing CantoVario under the direction of Diana Dabby and using her algorithms for generating new music from existing music, using Lorenz attractors.  SoundTouch is a C++ library, but CantoVario was in python, so I built a wrapper for it.

Now you can use it too!  PySoundTouch, a python wrapper for the SoundTouch library is available on github!  It’s easy to use, especially with the super-cool AudioReader abstraction that I made with it.

AudioReader provides a single interface to any audio file (currently MP3, WAV, AIF, and AU files are supported).  Here’s an example of using AudioReader with the SoundTouch library:

# Open the file and convert it to have SoundTouch's required 2-byte samples
reader = AudioReader.open(srcpath)
reader2 = ConvertReader(reader, set_raw_width=2)

# Create the SoundTouch object and set the given shift
st = soundtouch.SoundTouch(reader2.sampling_rate(), reader2.channels())
st.set_pitch_shift(shift)

# Create the .WAV file to write the result to
writer = wave.open(dstpath, 'w')
writer.setnchannels(reader2.channels())
writer.setframerate(reader2.sampling_rate())
writer.setsampwidth(reader2.raw_width())

# Read values and feed them into SoundTouch
while True:
    data = reader2.raw_read()
    if not data:
        break

    print len(data)
    st.put_samples(data)

    while st.ready_count() > 0:
        writer.writeframes(st.get_samples(11025))

# Flush any remaining samples
waiting = st.waiting_count()
ready = st.ready_count()
flushed = ""

# Add silence until another chunk is pushed out
silence = array('h', [0] * 64)
while st.ready_count() == ready:
    st.put_samples(silence)

# Get all of the additional samples
while st.ready_count() > 0:
    flushed += st.get_samples(4000)

st.clear()

if len(flushed) > 2 * reader2.getnchannels() * waiting:
    flushed = flushed[0:(2 * reader2.getnchannels() * waiting)]

writer.writeframes(flushed)

# Clean up
writer.close()
reader2.close()

Categories: Software

Web Scraping in Python

July 2, 2014 · Leave a Comment

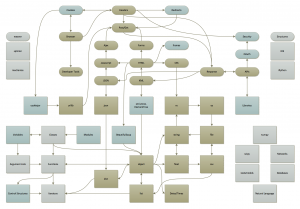
I’m running a pair of seminars to introduce people to python, for the purpose of extracting data from various online sources.  I still need to write up the content of the seminars, with plenty of examples at from trivial to intermediate.  But first, I wanted to post the diagram I did for myself, to think about how to organize all of this material: a diagram.

How do the elements of python connect to each other, how do they relate to elements on the web, and how do elements on the web related to each other?

Scraping Python Tutorial

Boxes are python elements and ovals are web elements. I aimed to cover everything in brown, touch on items in blue, and at-most mention items in grey.

Categories: Activities · Software · Teaching

Meta-Analysis Tool at AGU

December 12, 2013 · Leave a Comment

My second poster at AGU is on work with Solomon Hsiang and Bob Kopp, describing a new tool for comparing empirical results and performing meta-analyses. We are currently aiming the tool at climate impacts, but hope to expand its use to other fields.

AGU Poster

If you would like to try out the tool, go to the Alpha Testing Site.

Categories: Research · Software

Paraphrasing Code Released!

March 8, 2011 · Leave a Comment

I’ve just finished extracting and releasing the various blocks of code
necessary for automated paraphrasing (and some other things besides).
Get the code or dlls here:
https://github.com/jrising/Virsona-ChatBot-Tools

The README is currently very sparse, but it describe the code
available (which includes tagging, parsing, morphology, paraphrasing,
wordnet access, the plugin framework, and general-use tools) and how
to begin using it.  All of the code is LGPL.

The paraphrasing code was undergoing development when I stopped
working on it, so there’s a lot more that can be done.  It currently
just knows how replace words with unambiguous synonyms, rearrange noun
and verb conjunctions, and rearrange declarative phrases a few ways
(e.g. active to passive).  It can work on a complete body of text,
knows how to respect capitalization, and can try to emphasize
particular phrases.  And it’s quite fast, but often makes no changes
at all.

In my tests, it seems to be working fine, but I did have to rearrange
a fair amount of code and didn’t test if very thoroughly, so tell me
if there are any problems.

Categories: Software