James A. Rising

Entries categorized as ‘Activities’

Making your own duct tape wallet

October 27, 2015 · Leave a Comment

Duct Tape wallets are cool, thin and light, and personalizable. The instructions below describe my design, which I think is elegant, and you can modify to your heart’s content.

Step 1.

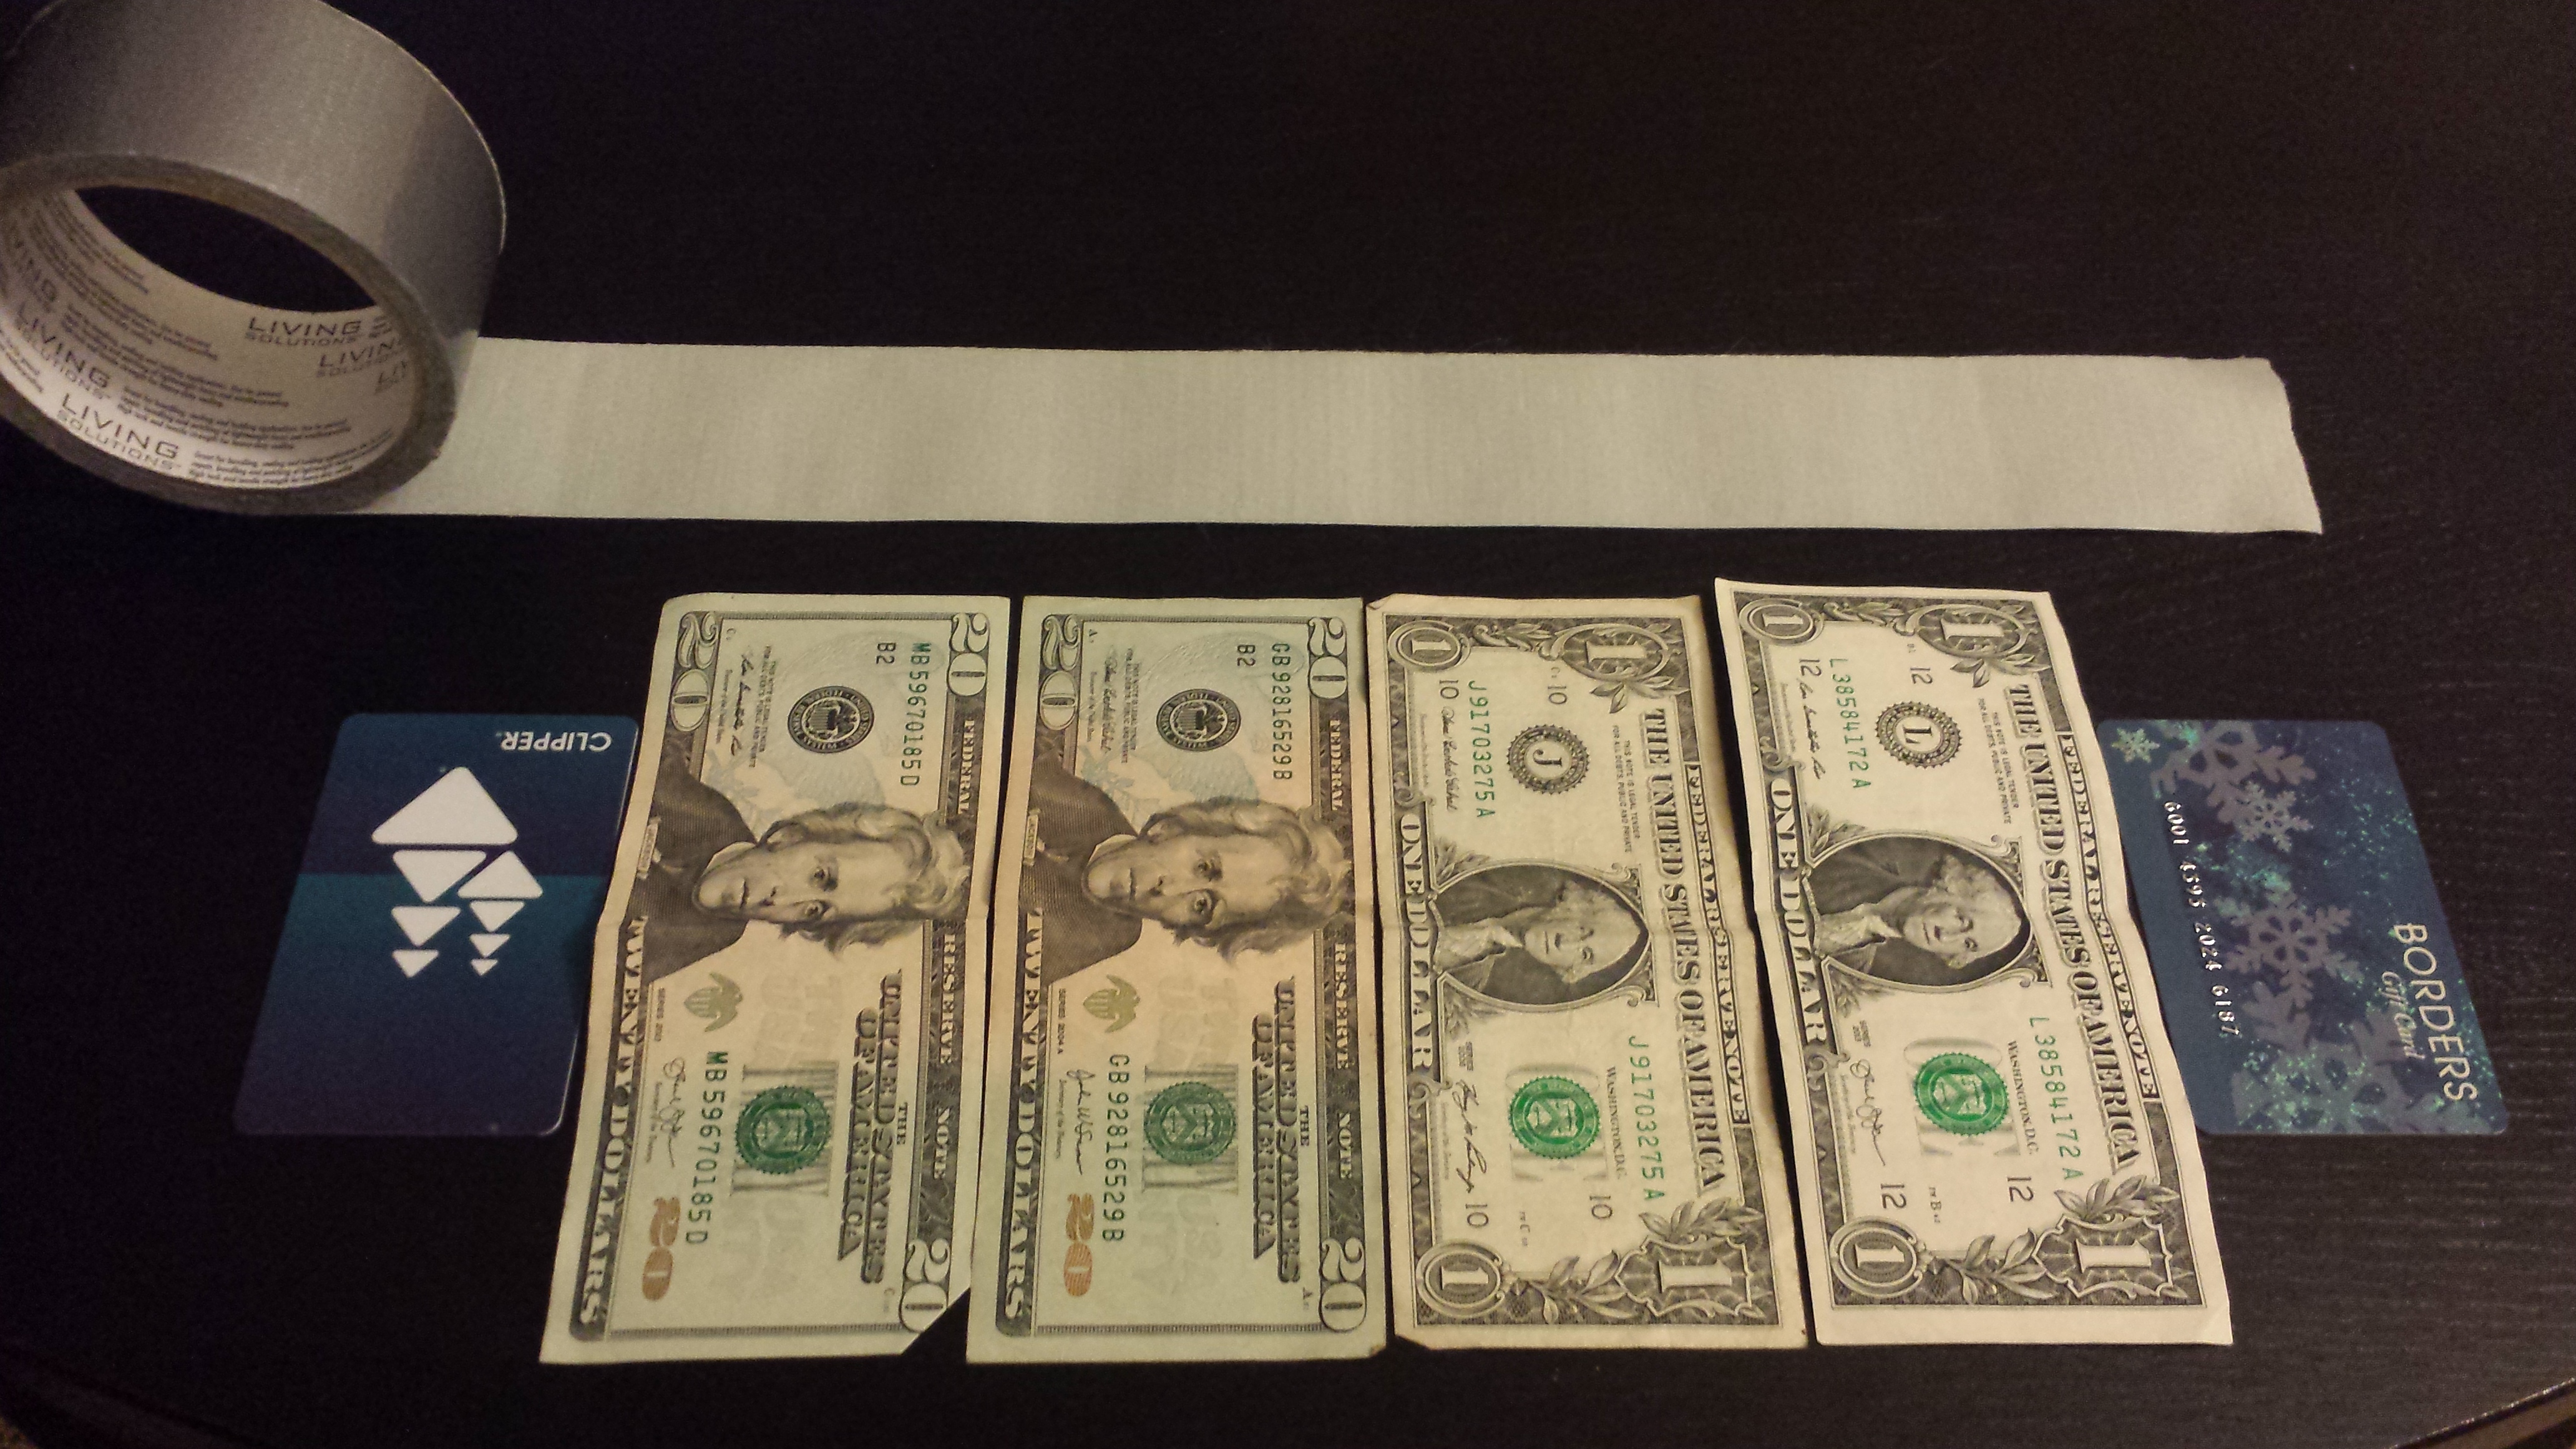
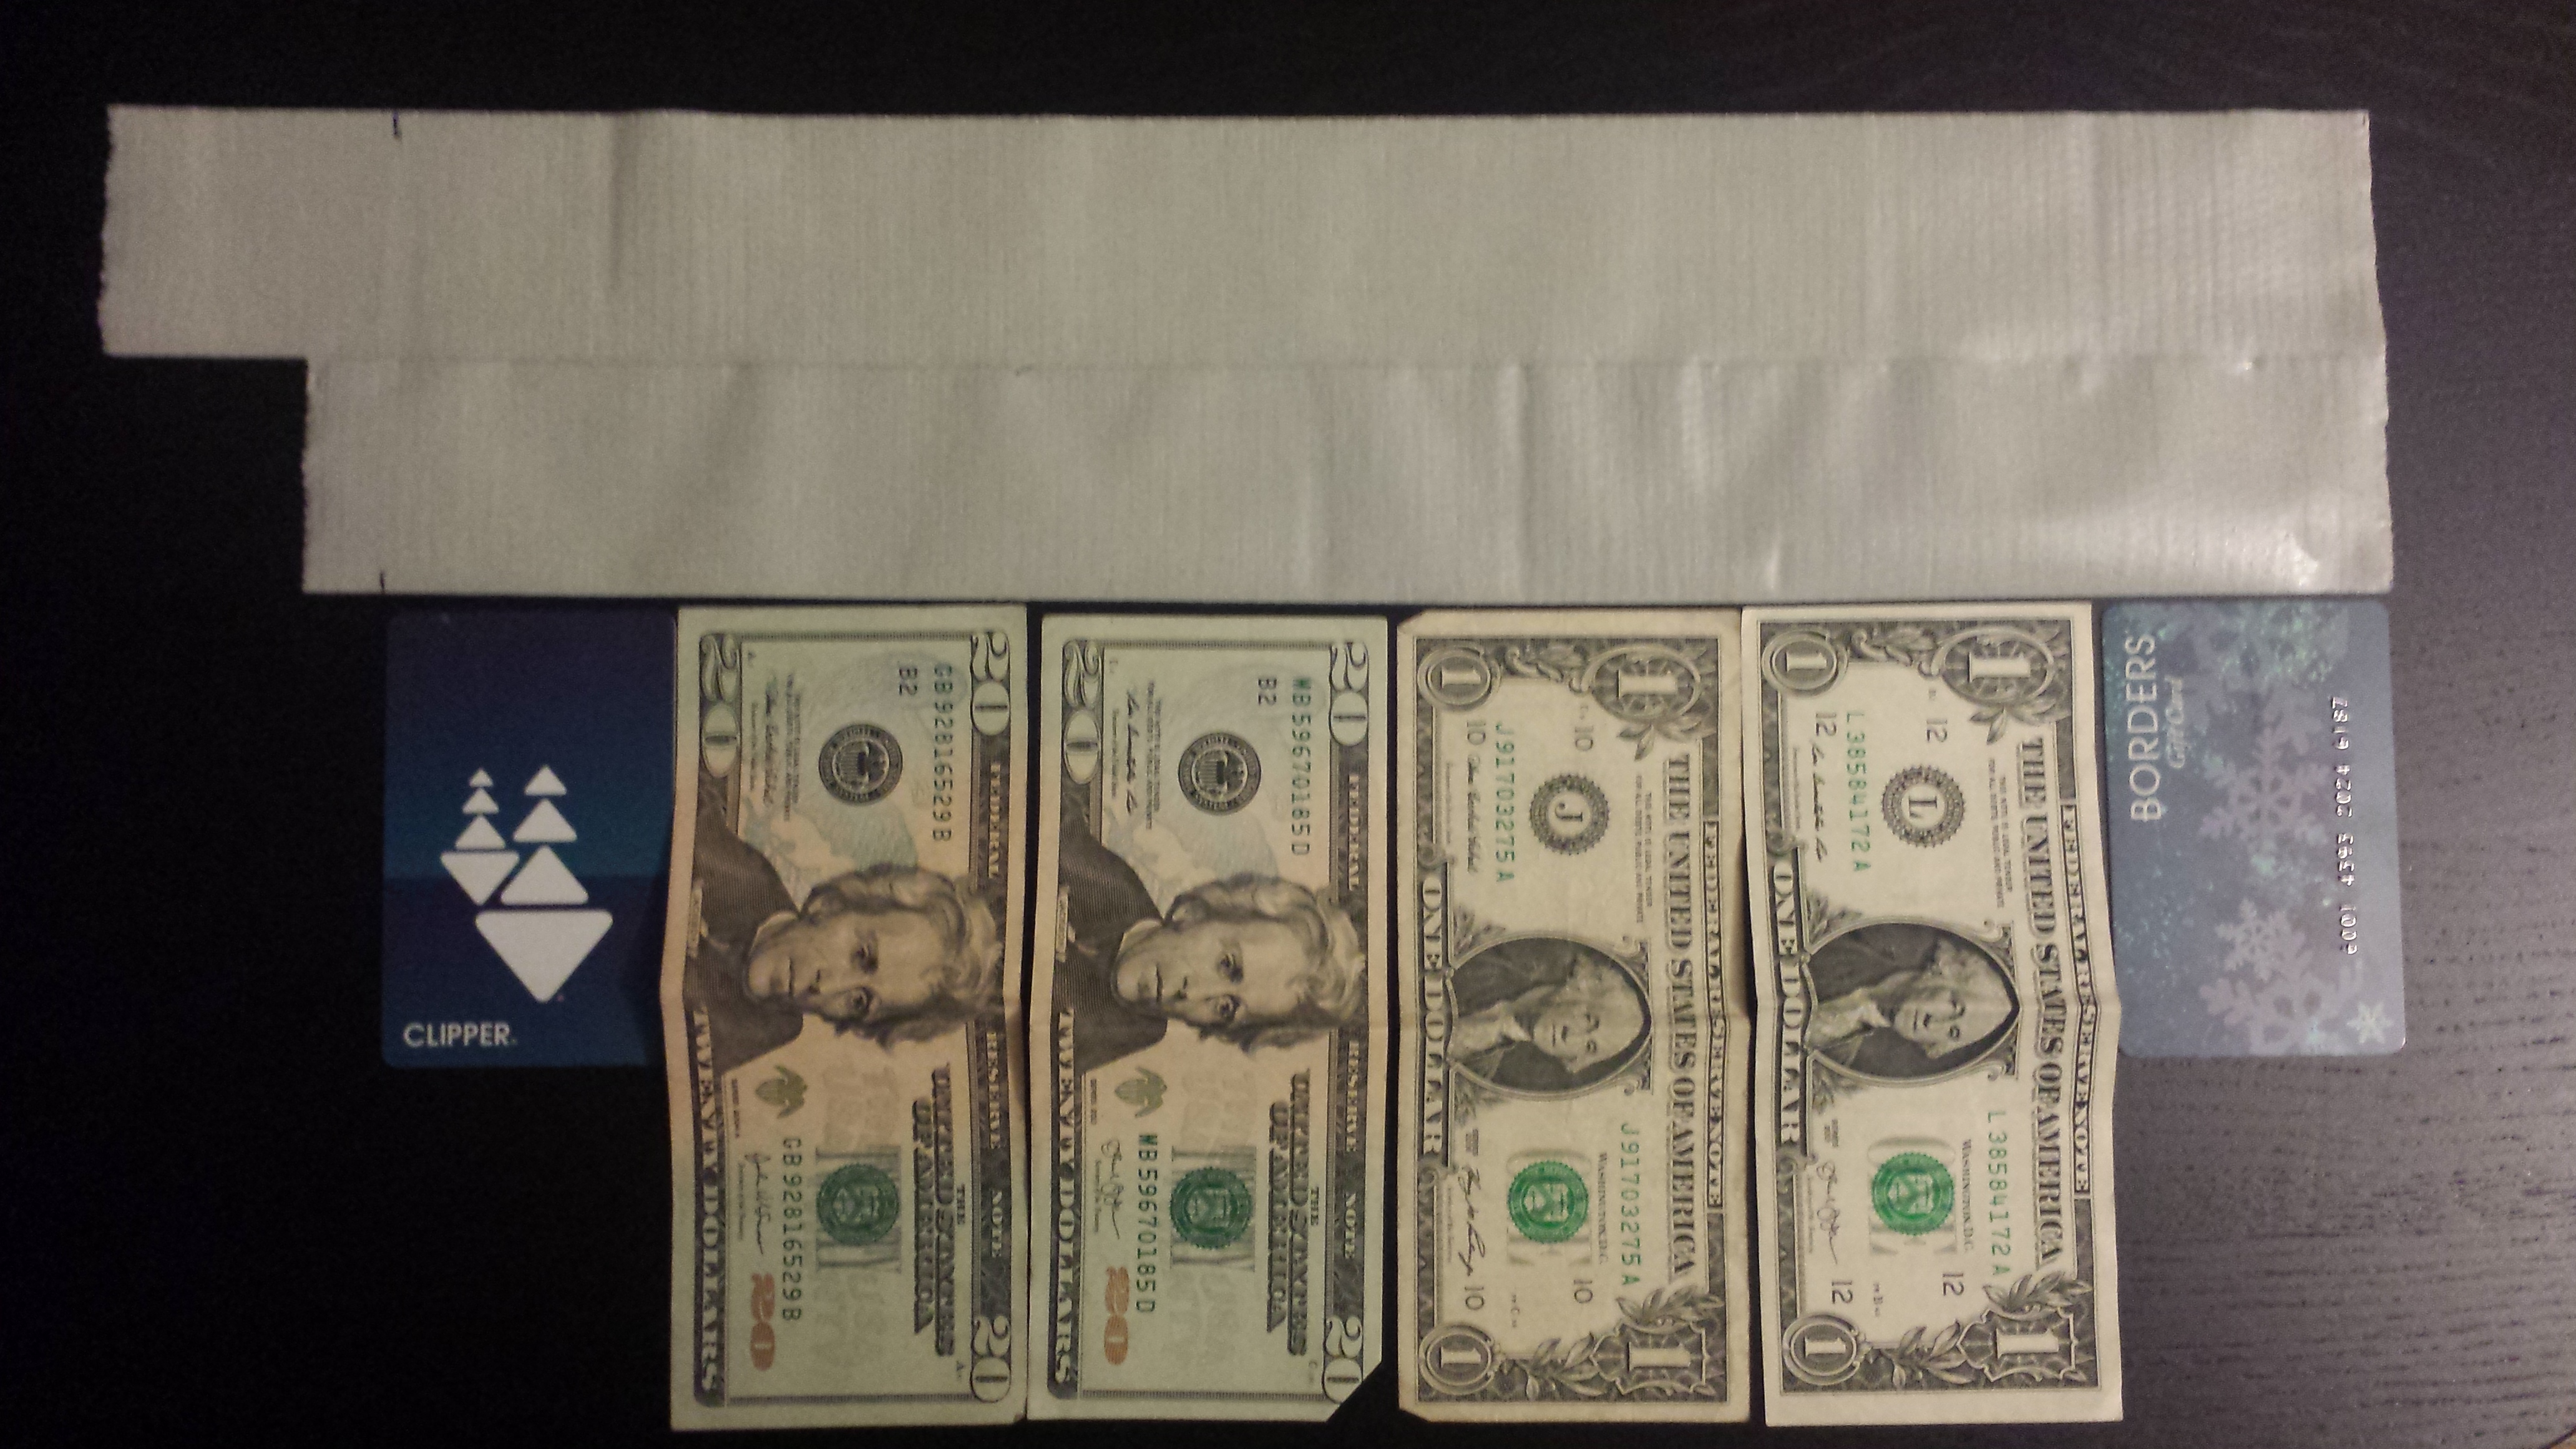
Measure out the length of the two longest strips of duct tape:

Line four bills up, just touching along their long edges. Rip two
small strips of duct tape to measure an additional width to the left
and right of the four bills, or use credit cards, as shown below.

How to measure the backbone

Measuring the backbone


Step 2.

Measure out one strips of duct tape this length and lay it sticky-side-up.
Then measure a second strip and lay it stick-side-up with just
enough overlap to form a secure connection.

The backbone diagramThe backbone


Step 3.

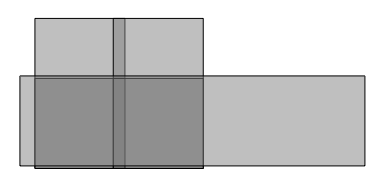
Fold the strips into the basic wallet frame, by first folding them
in half, with the sticky-side out. Then continue folding in an
accordian fashion, only allowing the faces with the same letter
shown below to stick together. Make sure that these adhering faces
are smooth an even.

Folding faces Folding result

First fold

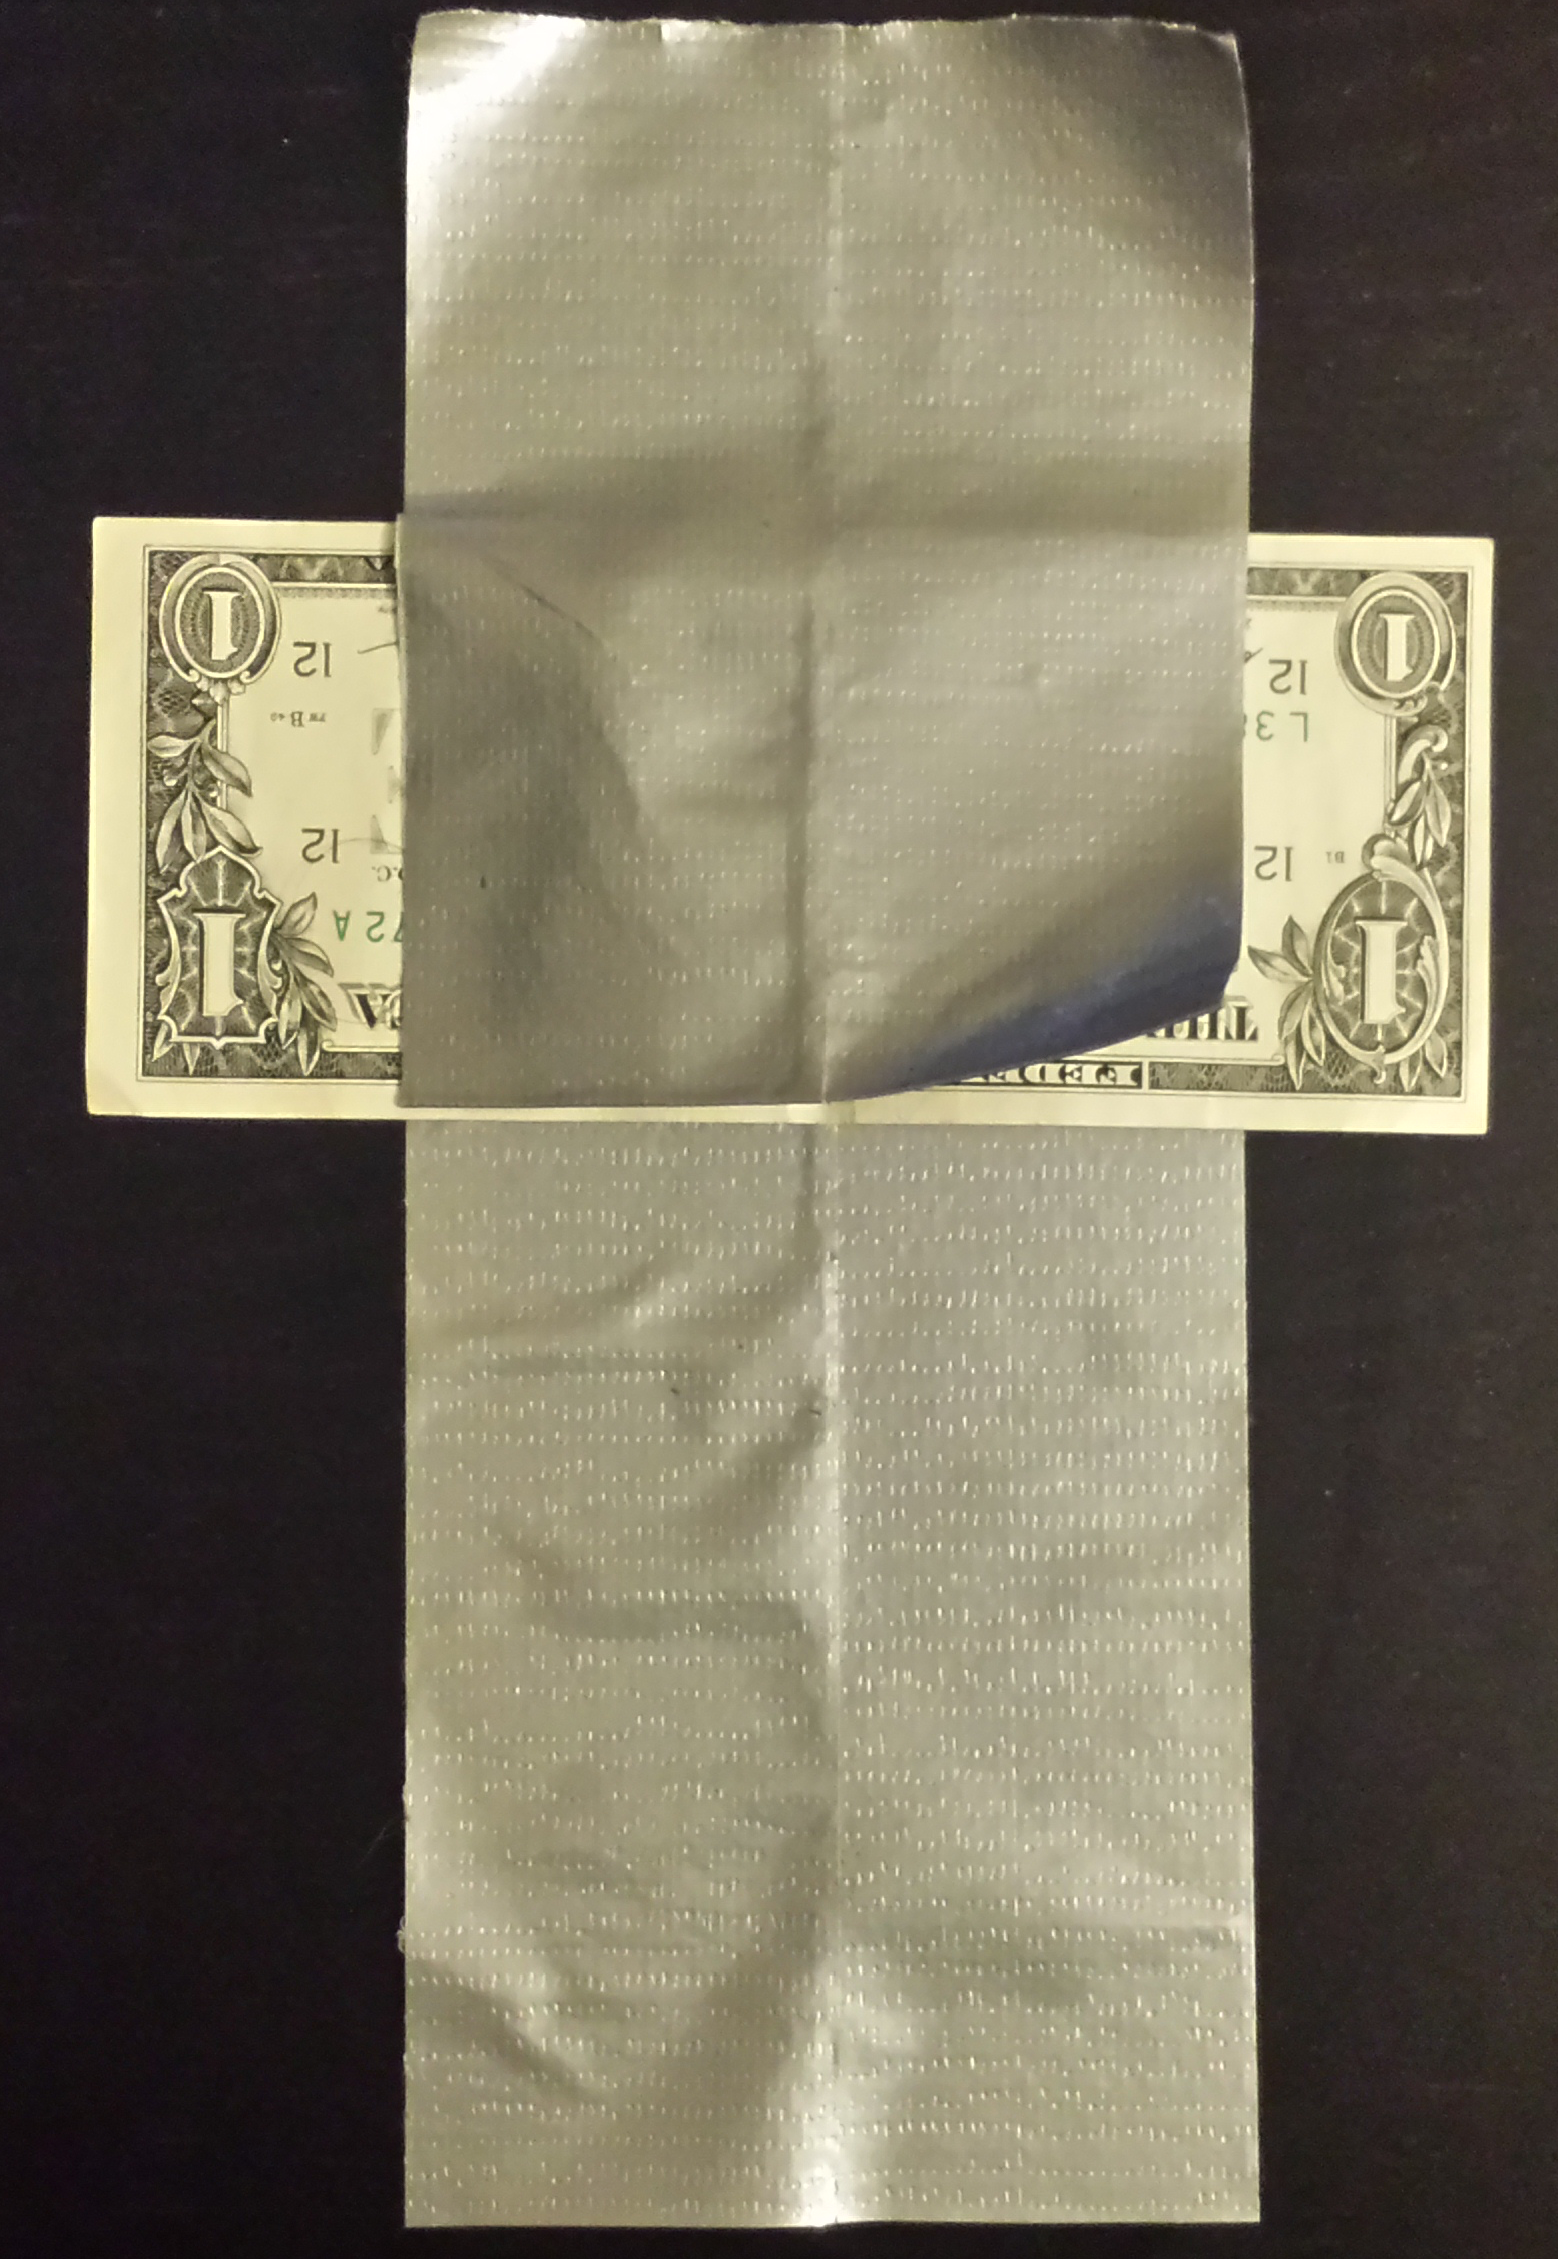
The first fold, in half, with a bill to measure the second fold.

Second fold

After the second fold.


Flip over

After the third fold and flipping over.

Final backbone

After the rest of the backbone folds.


Step 4.

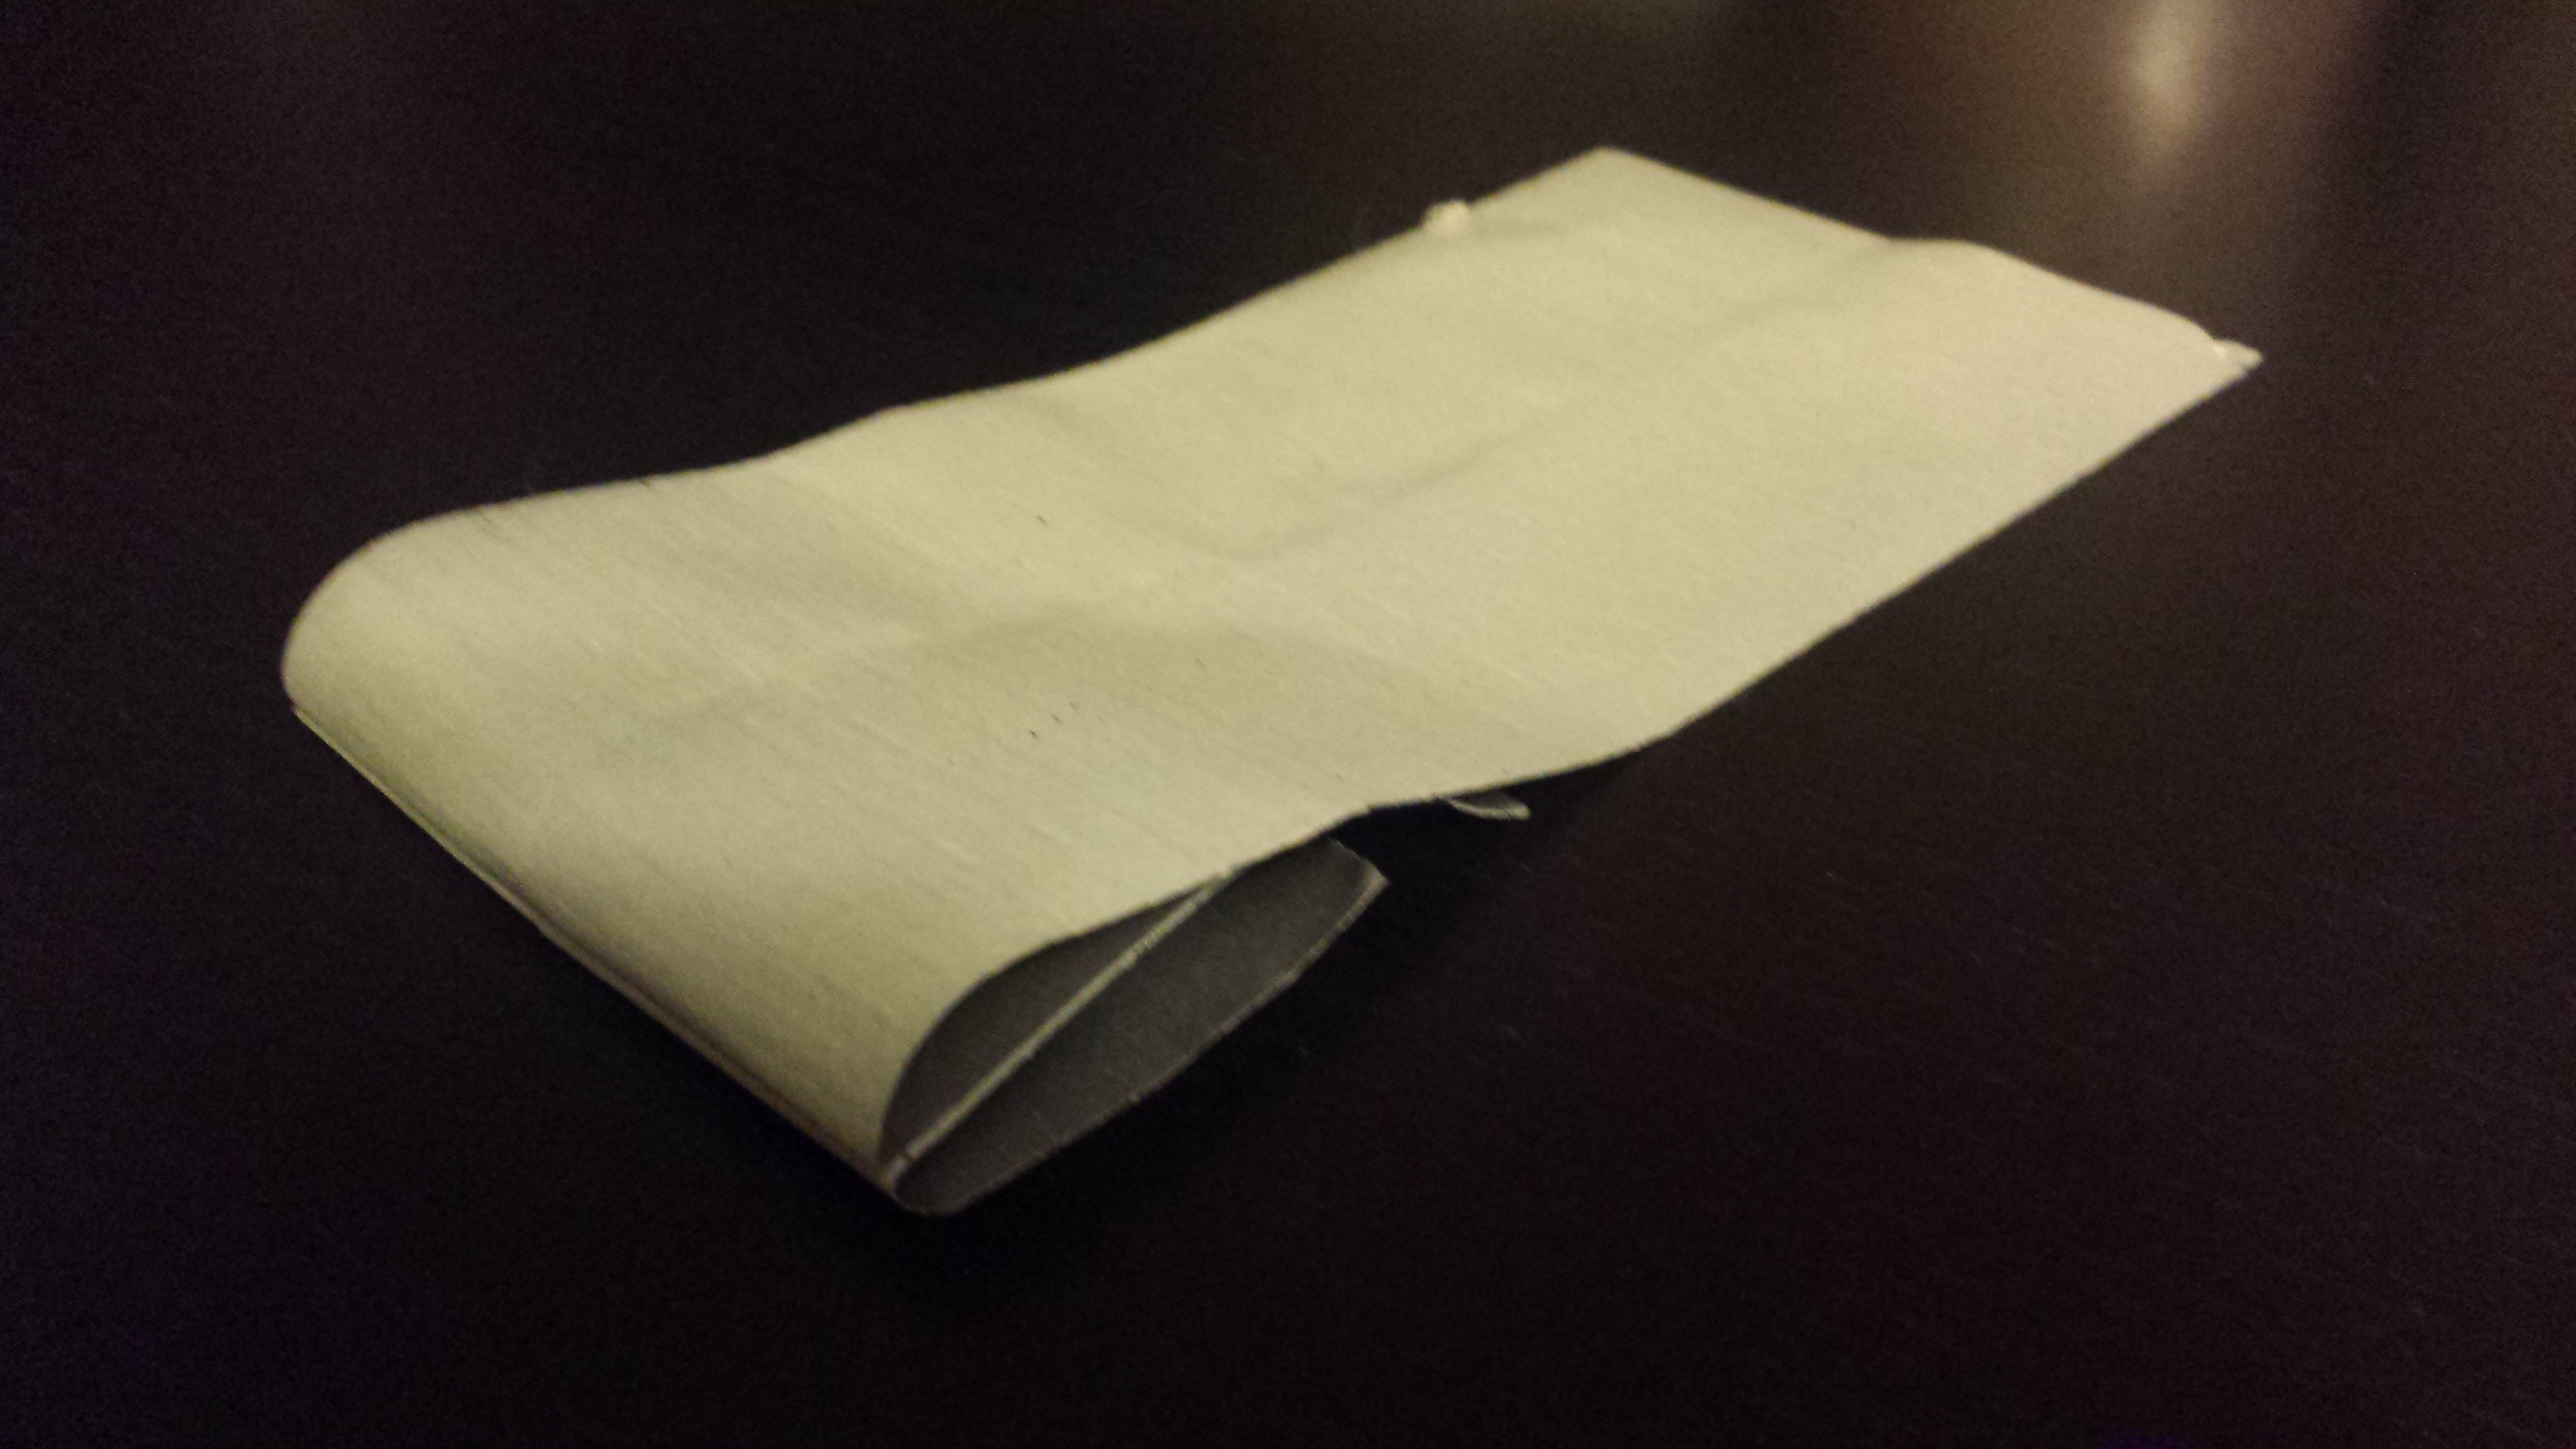
Measure out a length of duct tape a little larger than twice the
width of the wallet and wrap it around the outside, with the
sticky-side covering the remaining stick-side of the wallet frame.
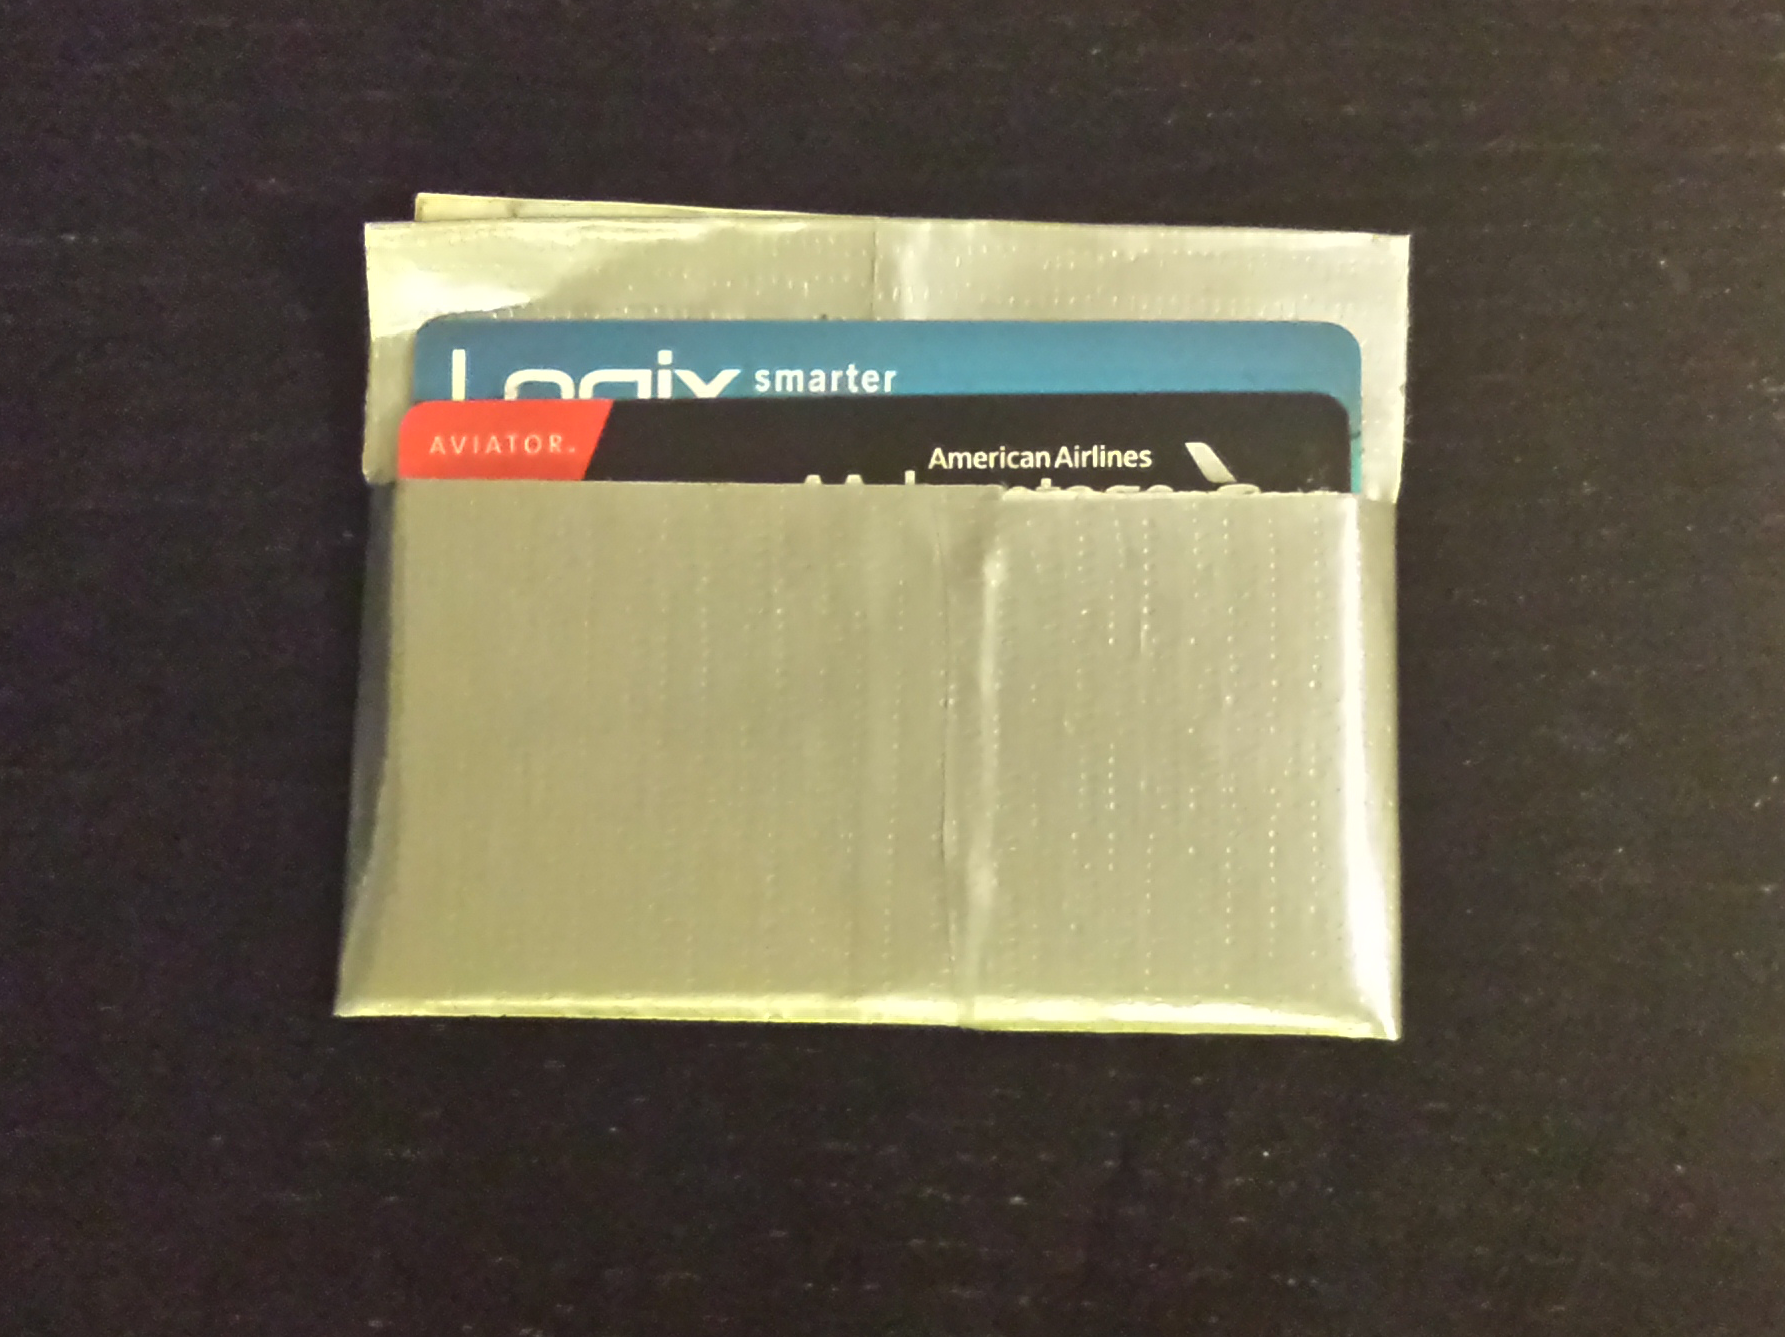
The wrapper diagram The wrapper


That’s it!  Enjoy your new wallet!

Final wallet

Categories: Activities

Classes Diagram

August 26, 2014 · Leave a Comment

Sometimes a diagram helps me find order in chaos, and sometimes it’s just a way to stroke my ego. I was recently trying to make sense of my graduate school classes, even as they’re becoming a less and less important share of my gradschool learning. So, I added to a diagram I’d made ten years ago for college.  In the end, I’m not sure which purpose it serves more.

classes

The diagram is arrayed by discipline and year. The disciplines are arranged like a color wheel (and classes colored accordingly), from theoretical math, through progressively more applied sciences, through engineering and out the other end into applied humanities (like music), and finally back to theoretical philosophy. Arrows give a sense of thematic and prerequisite relationships.

Economics, a core of the Sustainable Development program, probably sits around the back-side of the spectrum, between philosophy and math. I squeezed it in on the left, more as a reflection of how I’ve approached it than what it tried to teach.

This is also missing everything I’ve learned from classes I’ve taught. I wish there were a place for Progressive Alternatives from two years ago, or Complexity Science from last year. I guess I need another diagram.

Categories: Activities

Web Scraping in Python

July 2, 2014 · Leave a Comment

I’m running a pair of seminars to introduce people to python, for the purpose of extracting data from various online sources.  I still need to write up the content of the seminars, with plenty of examples at from trivial to intermediate.  But first, I wanted to post the diagram I did for myself, to think about how to organize all of this material: a diagram.

How do the elements of python connect to each other, how do they relate to elements on the web, and how do elements on the web related to each other?

Scraping Python Tutorial

Boxes are python elements and ovals are web elements. I aimed to cover everything in brown, touch on items in blue, and at-most mention items in grey.

Categories: Activities · Software · Teaching

Risky Business: The Economic Risks of Climate Change in the United States

June 20, 2014 · Leave a Comment

Next Thursday I’ll be in DC for one of the briefings on a big report I’ve been helping write. The event is at Resources for the Future– feel free to join in.

A Discussion of the Independent Risk Assessment for Risky Business: The Economic Risks of Climate Change in the United States

How much economic risk does the nation face from the impacts of climate change? The Risky Business initiative—a project of Bloomberg Philanthropies, the Office of Hank Paulson, and Next Generation—works to answer that question. Using the best information available, the initiative outlines the range of climate futures that the United States might expect in major economic sectors and by geographic region. It also examines the likelihood of these futures and the potential economic consequences for American businesses and households. The initiative does not advocate any particular policy, industry, or personal response to climate change but instead seeks to provide government, finance, business, and household decisionmakers with the information necessary to make their own risk management decisions.

At this RFF seminar, Trevor Houser, lead author of the independent risk assessment supporting the Risky Business initiative, and his colleagues will present an overview of the methods, data, original research, and key findings in the assessment. A panel of experts will then offer additional perspectives.

Categories: Activities

Science and Policy Summer School

August 21, 2012 · Leave a Comment

This past June, a core group of the PhD students organised the first Science and Policy Summer School at the Columbia Global Center in Paris. With help from the Alliance Program and professors at both Columbia and Sciences Po, we were able to convene a group of 17 students from both sides of the Atlantic (Columbia, Arizona State, and the Universities of Minnesota and Southern California, and from Sciences Po, Pantheon-Sorbonne, École Polytechnique, École Normale Supérieure, and the Paris School of Economics) with 9 speakers (including Jeff Sachs, John Mutter, and Scott Barrett; Bruno Latour, Claude Henry, and Pierre-Henri Gouyon from Paris; Eric Maskin from Princeton; and representatives from the French government and NGOs).

The interdisciplinary, discussion-centered approach brought together a wide range of perspectives.  Discussions were lively, with students and professors engaging research and experience to better understand how to bridge the gap between science and policy-making. At the end of the week, student groups presented on the results of their own meetings and research.  Themes included scientific approaches to decision-making, South-South cooperation, global and national needs, the role of stakeholders, and international cooperation.  The participants left the summer school with renewed interest in continuing to discuss these topics and collaborate on reports and papers.

You can also read about the summer school in this article in the Sciences Po Newsletter, Global Horizons: http://www.sciencespo.fr/newsletter/actu/?id=2230.

We are hoping to continue this effort by having a second Science and Policy Summer School, and as the planning process begins, we hope to widen our community.  Contact me if you want to get involved.

Categories: Activities · Policy