
Schlenker and Roberts (2009) use daily minimum and maximum temperatures to calculate growing degrees, rather than daily mean temperatures. This is important when the effect of extreme temperatures is an issue, since these often will not show up in mean temperatures.
Growing degree days form a useful model of crop productivity. DMAS has examples of these for maize, soybeans, and cotton.
To do this, they use a sinusoidal approximation, integrating the area of a curve through the minimum and maximum temperatures:
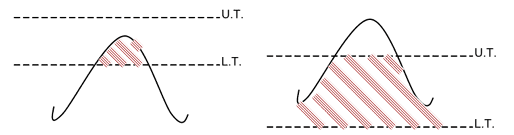
(adapted from here— but don’t use their calculations!)
The calculations aren’t very difficult, but require some careful math. I had a need to write them in python and translate them to R, so I’m providing them here for anyone’s benefit.
import numpy as np
import warnings

warnings.simplefilter("ignore", RuntimeWarning)

def above_threshold(mins, maxs, threshold):
    """Use a sinusoidal approximation to estimate the number of Growing
Degree-Days above a given threshold, using daily minimum and maximum
temperatures.

mins and maxs are numpy arrays; threshold is in the same units."""

    # Determine crossing points, as a fraction of the day
    plus_over_2 = (mins + maxs)/2
    minus_over_2 = (maxs - mins)/2
    two_pi = 2*np.pi
    # d0s is the times of crossing above; d1s is when cross below
    d0s = np.arcsin((threshold - plus_over_2) / minus_over_2) / two_pi
    d1s = .5 - d0s

    # If always above or below threshold, set crossings accordingly
    aboves = mins >= threshold
    belows = maxs <= threshold

    d0s[aboves] = 0
    d1s[aboves] = 1
    d0s[belows] = 0
    d1s[belows] = 0

    # Calculate integral
    F1s = -minus_over_2 * np.cos(2*np.pi*d1s) / two_pi + plus_over_2 * d1s
    F0s = -minus_over_2 * np.cos(2*np.pi*d0s) / two_pi + plus_over_2 * d0s
    return np.sum(F1s - F0s - threshold * (d1s - d0s))

def get_gddkdd(mins, maxs, gdd_start, kdd_start):
    """Get the Growing Degree-Days, as degree-days between gdd_start and
kdd_start, and Killing Degree-Days, as the degree-days above
kdd_start.

mins and maxs are numpy arrays; threshold is in the same units."""

    dd_lowup = above_threshold(mins, maxs, gdd_start)
    dd_above = above_threshold(mins, maxs, kdd_start)
    dd_lower = dd_lowup - dd_above

    return (dd_lower, dd_above)
2 responses so far ↓
Hung Trung VO // March 24, 2021 at 10:14 am |
Dear Professor James Rising,
My name is Hung Vo, a Phd student that studies agricultural economics at the University of Montpellier Supagro, France. I saw your code on Growing Degree Day computation which is very helpful but seems slightly different from the traditional approaches that I know. I would like to ask if you can give me some references for the theoretical framework that you used to compute the GDD.
Thanks for your help,
Best regards,
Hung VO
admin // March 29, 2021 at 12:01 am |
Thanks for reaching out. My approach just integrates a sinusoidal curve between the given GDD bounds, which is described in Snyder, R. L. (1985). Hand calculating degree days. Agricultural and forest meteorology, 35(1-4), 353-358.
I do not use the table from that paper though, since a table-based look-up would just be an approximation.