After NASA released the 2017 global average temperature, I started getting worried. 2017 wasn’t as hot as last year, but it was well above the trend.

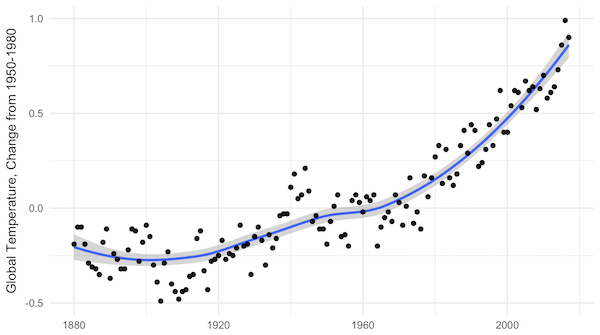
NASA yearly average temperatures and loess smoothed.
Three years above the trend is pretty common, but it makes you wonder: Do we know where the trend is? The convincing curve above is increasing at about 0.25°C per decade, but in the past 10 years, the temperature has increased by almost 0.5°C.
Depending on how far back you look, the more certain you are of the average trend, and the less certain of the recent trend. Back to 1900, we’ve been increasing at about 0.1°C per decade; in the past 20 years, about 0.2°C per decade; and an average of 0.4°C per decade in the past 10 years.
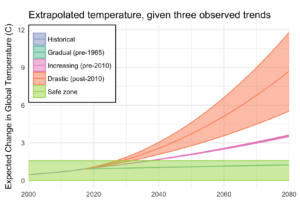
A little difference in the trend can make a big difference down the road. Take a look at where each of these get you, uncertainty included:
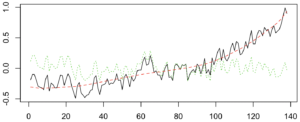
A big chunk of the fluctuations in temperature from year to year are actually predictable. They’re driven by cycles like ENSO and NAO. I used a nice data technique called “singular spectrum analysis” (SSA), which identifies the natural patterns in data by comparing a time-series to itself at all possible offsets. Then you can take extract the signal from the noise, as I do below. Black is the total timeseries, red is the main signal (the first two components of the SSA in this case), and green is the noise.
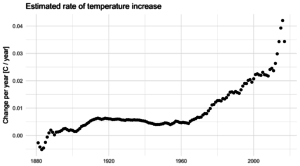
Once the noise is gone, we can look at what’s happening with the trend, on a year-by-year basis. Suddenly, the craziness of the past 5 years becomes clear:
It’s not just that the trend is higher. The trend is actually increasing, and fast! In 2010, temperatures were increasing at about 0.25°C per decade, an then that rate began to jump by almost 0.05°C per decade every year. The average from 2010 to 2017 is more like a trend that increases by 0.02°C per decade per year, but let’s look at where that takes us.
If that quadratic trend continues, we’ll blow through the “safe operating zone” of the Earth, the 2°C over pre-industrial temperatures, by 2030. Worse, by 2080, we risk a 9°C increase, with truly catastrophic consequences.
This is despite all of our recent efforts, securing an international agreement, ramping up renewable energy, and increasing energy efficiency. And therein lies the most worrying part of it all: if we are in a period of rapidly increasing temperatures, it might be because we have finally let the demon out, and the natural world is set to warm all on its own.


0 responses so far ↓
There are no comments yet...Kick things off by filling out the form below.